Awareness Survey of 18-Year-Olds – Values and EducationResults of 67th installment announced – Survey of 100 young people each in Japan’s 47 prefectures to study regional differences

With an aging, contracting population that is becoming increasingly concentrated in large urban areas, cities, towns, and villages are finding it increasingly difficult to maintain local government functions. The Japanese government’s Population Strategy Council released a report in April 2024 forecasting that 744 of 1,729 local municipalities nationwide, corresponding to more than 40% of the total, were at risk of ceasing to exist in roughly the next 30 years.
Against this backdrop, the 67th installment of the Awareness Survey of 18-Year-Olds, launched by The Nippon Foundation in October 2018, was carried out on November 21 – December 2, 2024, on the theme of “Values and Education.” The survey covered 100 people between the ages of 17 and 19 in each of Japan’s 47 prefectures, for a total of 4,700 respondents, on topics including their impressions and feelings about the place they lived when they were 15 years old, as well as things like their intentions regarding higher education. There are few surveys that cover the young people of the next generation nationwide and compare the results by region, and we expect this survey to become a fundamental document in regional revitalization efforts going forward.
First, the percentage of respondents intending to go to university in the three major metropolitan areas* was in the 80%-90% range, while for other areas* the percentage was less than 70%. The top two reasons for not intending to go to university were the same for both groups: “The high cost,” followed by “I want to work and live on my own as soon as possible.” For those intending to go to university, the top motivation for both groups was “There is a university that is aligned with my own interests.”
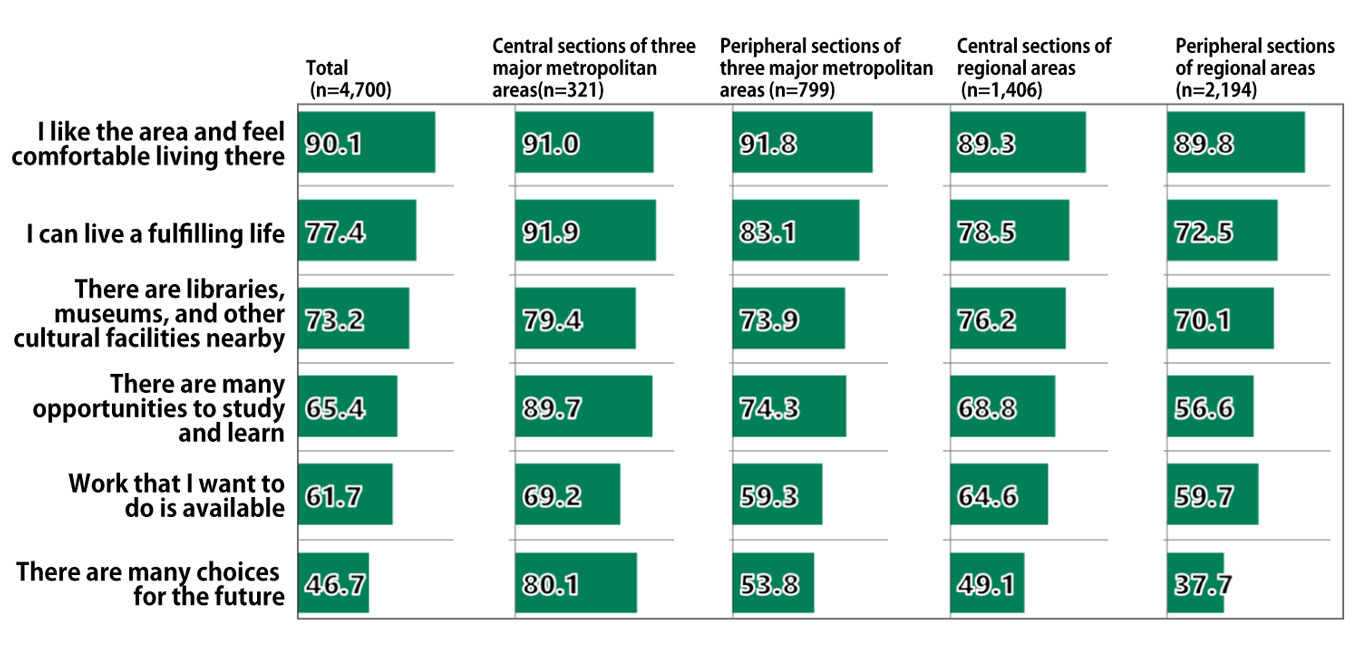
On other topics, respondents living in the three major metropolitan areas tended to be more likely than those in other areas to say that the area where they live offers more choices for the future and are places where they can live a fulfilling life.
- For the purposes of this survey, respondents’ municipalities are classified into four types, as follows:
| Central sections of three major metropolitan areas (Tokyo, Osaka, Nagoya) | Ordinance-designated cities (i.e. population of at least 500,000) of Saitama, Chiba, Kanagawa, Aichi, Kyoto, Osaka and Hyogo prefectures, and Tokyo’s 23 wards |
|---|---|
| Peripheral sections of three major metropolitan areas (Tokyo, Osaka, Nagoya) | Ibaraki Prefecture, areas other than ordinance-designated cities of Saitama, Chiba, Kanagawa, Aichi, Kyoto, Osaka and Hyogo prefectures, areas of Tokyo other than the 23 wards, Mie Prefecture, Nara Prefecture |
| Central sections of regional areas | Ordinance-designated cities in prefectures other than Ibaraki, Saitama, Chiba, Tokyo, Kanagawa, Aichi, Mie, Kyoto, Osaka, Hyogo, and Nara prefectures |
| Peripheral sections of regional areas | Other than the above |
Highlights of the 67th Awareness Survey of 18-Year-Olds – Values and Education
Regarding the place where they live
| Total (n=4,700) | Central sections of three major metropolitan areas (n=321) | Peripheral sections of three major metropolitan areas (n=779) | Central sections of regional areas (n=1,406) | Peripheral sections of regional areas (n=2,194) | |
|---|---|---|---|---|---|
| I like the area and feel comfortable living there | 90.1 | 91.0 | 91.8 | 89.3 | 89.8 |
| I can live a fulfilling life | 77.4 | 91.9 | 83.1 | 78.5 | 72.5 |
| There are libraries, museums, and other cultural facilities nearby | 73.2 | 79.4 | 73.9 | 76.2 | 70.1 |
| There are many opportunities to study and learn | 65.4 | 89.7 | 74.3 | 68.8 | 56.6 |
| Work that I want to do is available | 61.7 | 69.2 | 59.3 | 64.6 | 59.7 |
| There are many choices for the future | 46.7 | 80.1 | 53.8 | 49.1 | 37.7 |
Survey Excerpts
Feeling about place where you lived at around age 15 (graduation from junior high school; by type of municipality)
Feeling about place where you lived at around age 15 (graduation from junior high school; by prefecture): There are many choices for the future
- Total of “Agree” and “Somewhat agree.” Number of respondents (n) for each prefecture is 100
Top 5 prefectures
- 1 Kanagawa 77.0%
- 2 Tokyo 75.0%
- 3 Osaka 74.0%
- 4 Kyoto 72.0%
- 5 Aichi 68.0%
Bottom 5 prefectures
- 42 Aomori, Ehime 32.0%
- 44 Akita 31.0%
- 45 Wakayama, Kochi 28.0%
- 47 Tottori 27.0%
There are libraries, museums, and other cultural facilities nearby
Top 5 prefectures
- 1 Tokyo 85.0%
- 2 Osaka 75.0%
- 3 Saitama, Ichikawa 74.0%
- 5 Tochigi, Toyama 72.0%
Bottom 5 prefectures
- 43 Okinawa 65.0%
- 44 Kagoshima 63.0%
- 45 Gunma 61.0%
- 46 Yamagata, Tokushima 55.0%
I can live a fulfilling life
Top 5 prefectures
- 1 Tokyo 93.0%
- 2 Kyoto 92.0%
- 3 Kanagawa, Shizuoka, Osaka 91.0%
Bottom 5 prefectures
- 42 Yamagata, Mie 66.0%
- 44 Akita 64.0%
- 45 Wakayama 63.0%
- 46 Aomori 61.0%
- 47 Kochi 57.0%
There are many opportunities to study and learn
Top 5 prefectures
- 1 Tokyo, Osaka 86.0%
- 3 Saitama 85.0%
- 4 Kyoto 84.0%
- 5 Fukuoka 82.0%
Bottom 5 prefectures
- 43 Tokushima, Miyazaki 50.0%
- 45 Kochi 49.0%
- 46 Akita, Yamagata 43.0%
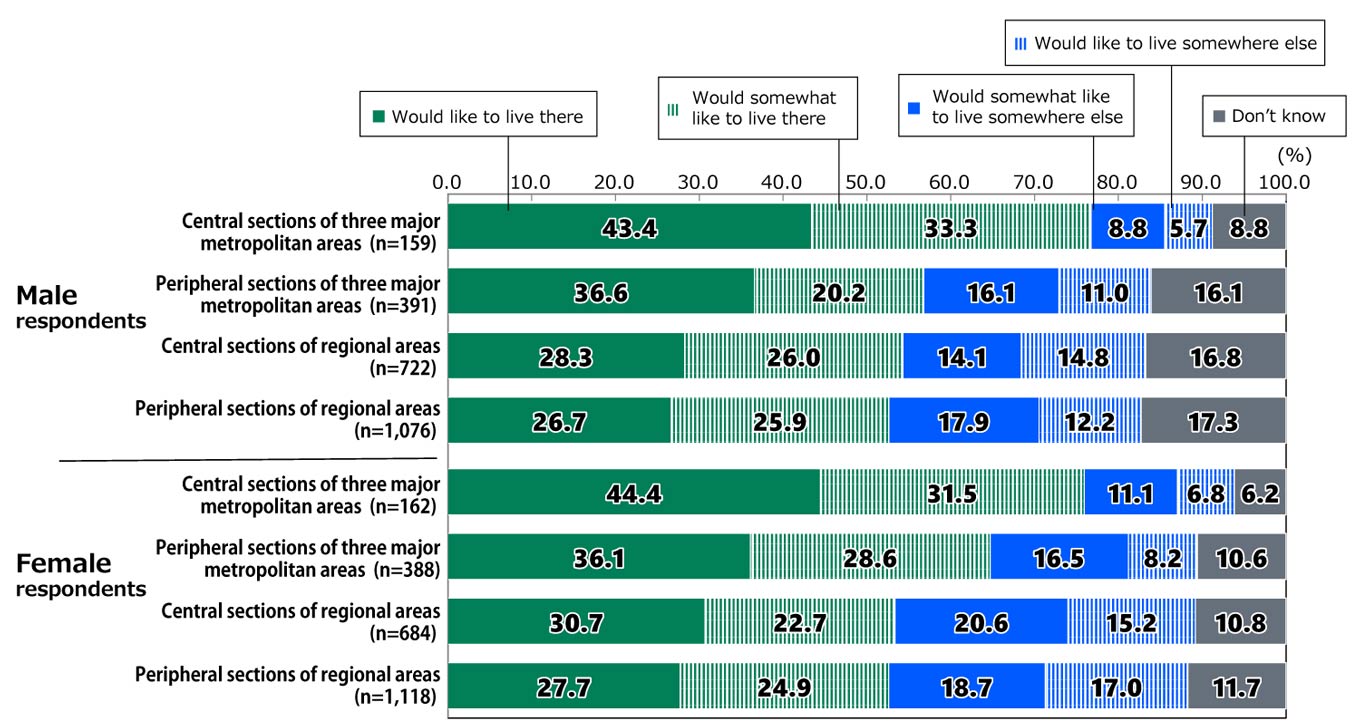
In the future, would you like to live in the prefecture where you lived at around age 15 (graduation from junior high school; by type of municipality)
In the future, would you like to live in the prefecture where you lived at around age 15 (graduation from junior high school; by prefecture)
- Total of “Would like to live there” and “Would somewhat like to live there.” Number of respondents (n) for each prefecture is 100.
Top 5 prefectures
- 1 Kanagawa 84.0%
- 2 Osaka 77.0%
- 3 Tokyo 76.0%
- 4 Aichi 74.0%
- 5 Shizuoka 67.0%
Bottom 5 prefectures
- 43 Gunma, Mie 43.0%
- 45 Miyazaki 42.0%
- 46 Iwate, Wakayama 41.0%
Notes:
- From the 13th survey, the number of respondents, comprising men and women aged 17 to 19, has been increased to 1,000 from 800. (The 67th installment covered 4,700 respondents on a one-time basis.)
- With the exceptions of the 20th, 46th, and 62nd installments, all surveys cover respondents in Japan only.
Related Link
Contact
Global Communications Team
The Nippon Foundation
- Email: info_global_communication@ps.nippon-foundation.or.jp