Awareness Survey of 18-Year-Olds – Values and Life DesignResults of 77th installment announced – 7-point decrease in respondents who want to marry and have children, 5-point increase in those who want to live in Japan

Awareness Survey of 18-Year-Olds

The 77th installment of the Awareness Survey of 18-Year-Olds was carried out from late November to early December 2025, asking young people aged 17 to 19 about their values and views on careers, marriage and partnerships, and child-rearing. The results were also compared with the 52nd Survey, carried out on the same theme in December 2022.

On the subject of values, when asked about the most important things in life (with up to three responses allowed), “family” fell by 7 percentage points, to 52.6%, with “Things I enjoy or like to do, hobbies” as the most cited reply and declines for both “friends” and “(romantic) love.” Replies for which increases were seen included “building wealth,” suggesting a trend of greater emphasis on oneself. On the subject of where they wanted to live in the future, the percentage of respondents choosing Japan rose by 5 percentage points from the previous survey, to 88.8%.

With regard to marriage and partnership, the percentage of respondents wanting to get married in the future declined by 7 percentage points, to 58.1%, and of those who thought they actually would marry declined by 6 percentage points, to 44.8%. When asked about reasons for not getting married (with all applicable responses allowed), increases were seen for not wanting to lose one’s freedom and not wanting to raise children. Among male respondents, the percentage wanting to marry declined 9 percentage points, to 57.8%, and the percentage of those who thought they actually would marry declined by 8 percentage points, to 43.3%. Among female respondents, the percentage wanting to marry declined 6 percentage points, to 58.2%, and the percentage of those who thought they actually would marry declined by 4 percentage points, to 46.3%. The gap between men and women regarding economic difficulty as a reason to not wanting to marry widened, with an increase among male respondents and a decrease among female respondents.

On the topic of child-rearing, the percentage of respondents who want to have children declined by 7 percentage points, to 51.5%, while the percentage who thought they actually would have children was also 7 percentage points lower, at 38.9%. Among respondents who do not want to have children, the top reasons given (with all applicable responses allowed) in the previous survey, “the significant financial burden,” remained tied as the top reply but declined by 3 percentage points, while the previous No. 2 response, “the significant psychological burden,” was tied for first place. Among male respondents, the percentage who want to have children in the future declined by 9 percentage points, to 51.6%, while the percentage who thought they actually would have children declined by 8 percentage points, to 38.6%. Among female respondents, the respective declines were 4 percentage points to 51.4%, and 6 percentage points to 39.0%.

Survey Excerpts

Please note that the questions and replies included in the news release for the 77th Survey differ from those included in the 52nd Survey. For complete comparisons, please refer to the full reports in Japanese.

Where would you like to live in the future? (Single reply)
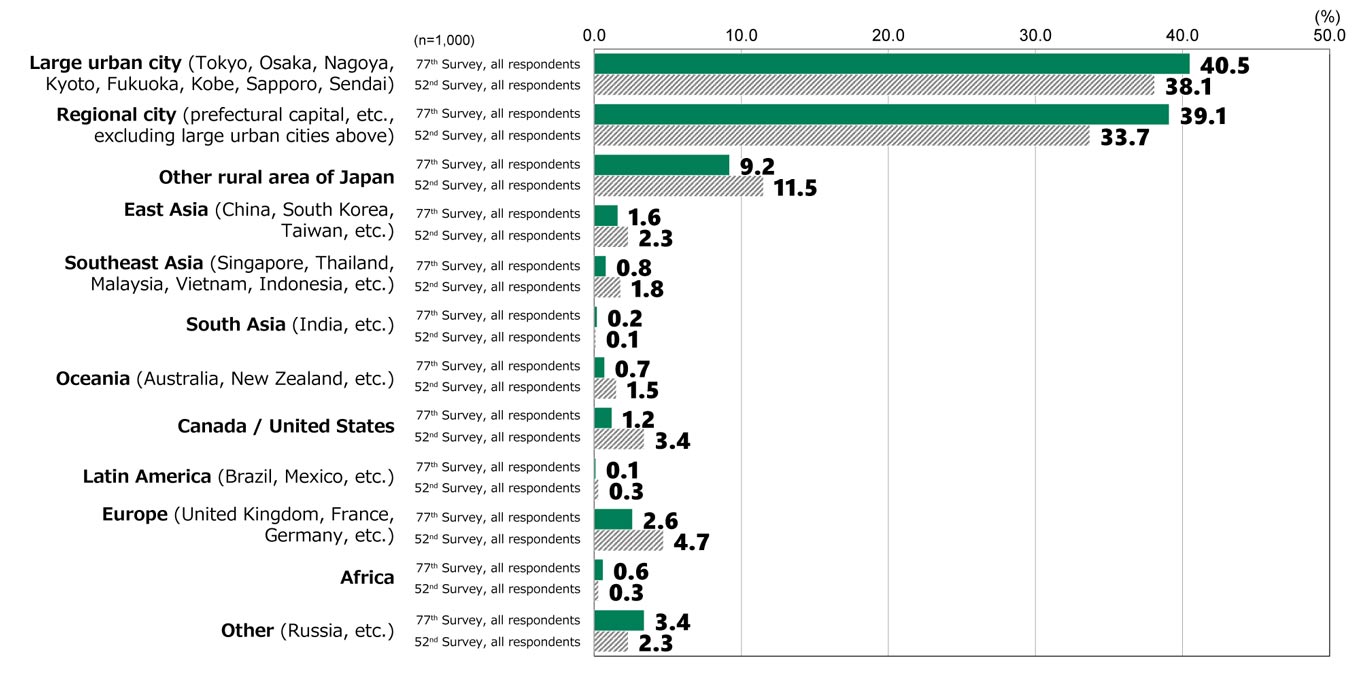
Bar chart showing results from Awareness Survey of 18-Year-Olds: In response to the question, “Where would you like to live in the future?”, among all respondents (n = 1,000 for both the 77th and 52nd surveys), the response for “Large urban city (Tokyo, Osaka, Nagoya, Kyoto, Fukuoka, Kobe, Sapporo, Sendai)” was 40.5% in the 77th Survey and 38.1% in the 52nd survey, for “Regional city (prefectural capital, etc., excluding large urban cities above) was 39.1% in the 77th Survey and 33.7% in the 52nd Survey, for “Other rural area of Japan” was 9.2% in the 77th Survey and 11.5% in the 52nd survey, for “East Asia (China, South Korea, Taiwan, etc.)” was 1.6% in the 77th Survey and 2.3% in the 52nd survey, for “Southeast Asia (Singapore, Thailand, Malaysia, Vietnam, Indonesia, etc.)” was 0.8% in the 77th Survey and 1.8% in the 52nd survey, for “South Asia (India, etc.)” was 0.2% in the 77th Survey and 0.1% in the 52nd survey, for “Oceania (Australia, New Zealand, etc.) was 0.7% in the 77th Survey and 1.5% for the 52nd survey, for “Canada / United States)” was 1.2% in the 77th Survey and 3.4% in the 52nd survey, for Latin America (Brazil, Mexico, etc.) was 0.1% in the 77th Survey and 0.3% in the 52nd survey, for “Europe (United Kingdom, France, Germany, etc.)” was 2.6% in the 77th Survey and 4.7% in the 52nd survey, for “Africa” was 0.6% in the 77th Survey and 0.3% in the 52nd survey, and for “Other (Russia, etc.)” was 3.4% in the 77th Survey and 2.3% in the 52nd survey.

Do you want to marry in the future?
(Among respondents who are not married, single reply)
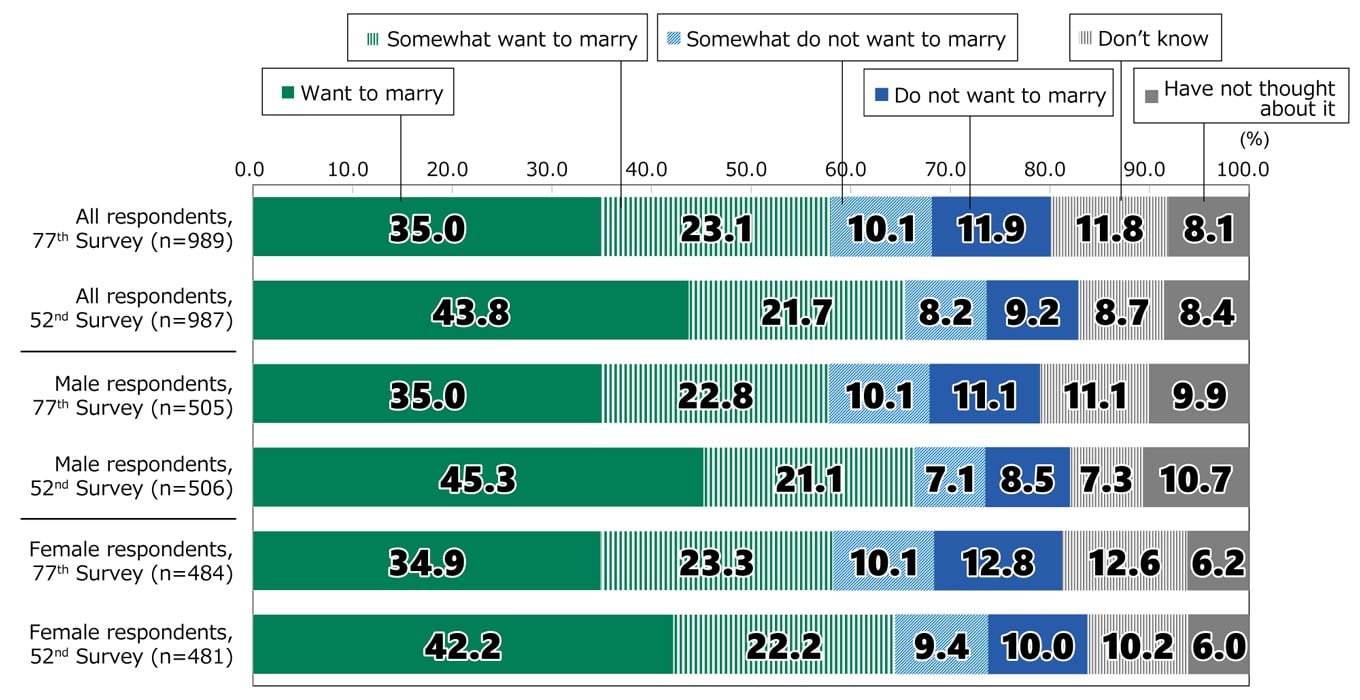
Bar chart showing results from Awareness Survey of 18-Year-Olds: In response to the question, “Do you want to marry in the future?” (Among respondents who are not married, single reply), among all respondents in the 77th Survey (n = 989), 35.0% replied “Want to marry,” 23.1% replied “Somewhat want to marry,” 10.1% replied “Somewhat do not want to marry,” 11.9% replied “Do not want to marry,” 11.8% replied “Don’t know,” and 8.1% replied “Have not thought about it.” Among all respondents in the 52nd Survey (n = 987), 43.8% replied “Want to marry,” 21.7% replied “Somewhat want to marry,” 8.2% replied “Somewhat do not want to marry,” 9.2% replied “Do not want to marry,” 8.7% replied “Don’t know,” and 8.4% replied “Have not thought about it.” Among male respondents in the 77th Survey (n = 505), 35.0% replied “Want to marry,” 22.8% replied “Somewhat want to marry,” 10.1% replied “Somewhat do not want to marry,” 11.1% replied “Do not want to marry,” 11.1% replied “Don’t know,” and 9.9% replied “Have not thought about it.” Among male respondents in the 52nd Survey (n = 506), 45.3% replied “Want to marry,” 21.1% replied “Somewhat want to marry,” 7.1% replied “Somewhat do not want to marry,” 8.5% replied “Do not want to marry,” 7.3% replied “Don’t know,” and 10.7% replied “Have not thought about it.” Among female respondents in the 77th Survey (n = 484), 34.9% replied “Want to marry,” 23.3% replied “Somewhat want to marry,” 10.1% replied “Somewhat do not want to marry,” 12.8% replied “Do not want to marry,” 12.6% replied “Don’t know,” and 6.2% replied “Have not thought about it.” Among female respondents in the 52nd Survey (n = 481), 42.2% replied “Want to marry,” 22.2% replied “Somewhat want to marry,” 9.4% replied “Somewhat do not want to marry,” 10.0% replied “Do not want to marry,” 10.2% replied “Don’t know,” and 6.0% replied “Have not thought about it.”

Do you want to have children in the future?
(Among respondents who do not have children, single reply)
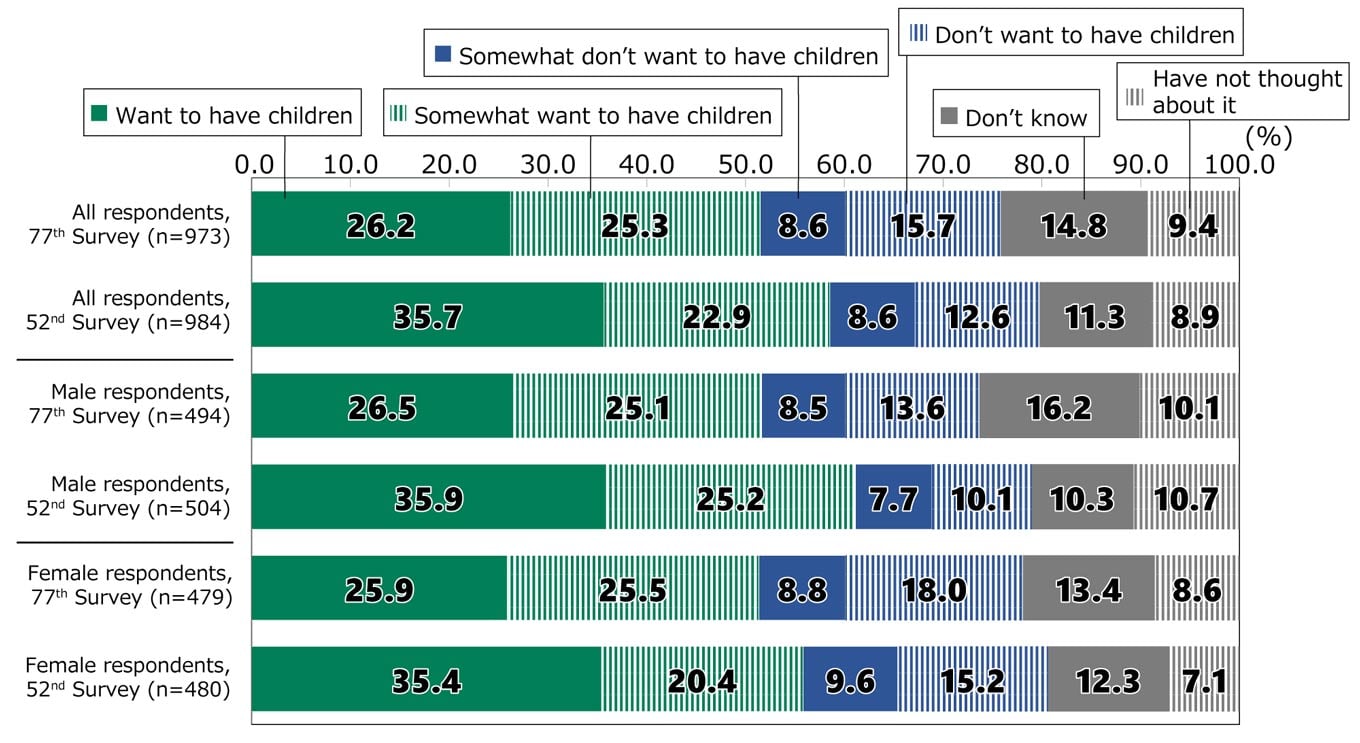
Bar chart showing results from Awareness Survey of 18-Year-Olds: In response to the question, “Do you want to have children in the future?” (Among respondents who do not have children, single reply), among all respondents in the 77th Survey (n = 973), 26.2% replied “Want to have children,” 25.3% replied “Somewhat want to have children,” 8.6% replied “Somewhat do not want to have children,” 15.7% replied “Do not want to have children,” 14.8% replied “Don’t know,” and 9.4% replied “Have not thought about it.” Among all respondents in the 52nd Survey (n = 984), 35.7% replied “Want to have children,” 22.9% replied “Somewhat want to have children,” 8.6% replied “Somewhat do not want to have children,” 12.6% replied “Do not want to have children,” 11.3% replied “Don’t know,” and 8.9% replied “Have not thought about it.” Among male respondents in the 77th Survey (n = 494), 26.5% replied “Want to have children,” 25.1% replied “Somewhat want to have children,” 8.5% replied “Somewhat do not want to have children,” 13.6% replied “Do not want to have children,” 16.2% replied “Don’t know,” and 10.1% replied “Have not thought about it.” Among male respondents in the 52nd Survey (n = 504), 35.9% replied “Want to have children,” 25.2% replied “Somewhat want to have children,” 7.7% replied “Somewhat do not want to have children,” 10.1% replied “Do not want to have children,” 10.3% replied “Don’t know,” and 10.7% replied “Have not thought about it.” Among female respondents in the 77th Survey (n = 479), 25.9% replied “Want to have children,” 25.5% replied “Somewhat want to have children,” 8.8% replied “Somewhat do not want to have children,” 18.0% replied “Do not want to have children,” 13.4% replied “Don’t know,” and 8.6% replied “Have not thought about it.” Among female respondents in the 52nd Survey (n = 480), 35.4% replied “Want to have children,” 20.4% replied “Somewhat want to have children,” 9.6% replied “Somewhat do not want to have children,” 15.2% replied “Do not want to have children,” 12.3% replied “Don’t know,” and 7.1% replied “Have not thought about it.”

About the Awareness Survey of 18-Year-Olds

Revisions to Japan’s Civil Code lowering the age of adulthood to 18 for a range of activities, including voting, took effect in April 2022, making it even more important to understand and record the awareness of the 18-year-olds who represent Japan’s next generation. With this in mind, in October 2018 The Nippon Foundation launched the Awareness Survey of 18-Year-Olds as an ongoing survey of young men and women across Japan aged around 18, to survey their values, attitudes toward politics and elections, understanding of social issues, and other current themes on an ongoing basis.

About the 77th Installment – Values and Life Design

Survey coverage 1,000 respondents comprising male and female respondents aged 17-19 from across Japan
Survey period November 28 – December 3, 2025
Survey method Internet survey

Related Link

Inquiries

Public Relations Division
The Nippon Foundation

  • Email: pr@ps.nippon-foundation.or.jp