Awareness Survey of 18-Year-Olds – Country and Society (6-Country Survey) Results of 78th installment announced – Large increase in Japanese respondents saying ‘My country has excellent leaders,’ while ‘Increase in immigrants’ rises among major issues

The 78th installment of the Awareness Survey of 18-Year-Olds was carried out during February 2026, asking young people aged 17 to 19 in six countries – Japan, the United States, the United Kingdom, China, South Korea, and India – about their views on their countries’ present circumstances and future outlook, and their relationship with society.
When asked what they considered the (three) major issues facing their own country, respondents in both Japan and South Korea, two countries with among the world’s highest rates of declining birthrate and aging population, the No. 1 and No. 2 replies, respectively, were “Declining birthrate” and “Aging population,” which were the same as in the previous (62nd) six-country survey, carried out in February 2024. Among Japanese respondents, those citing “increase in immigrants,” which ranked 12th in the previous survey, increased by a factor of three, to roughly 20%, and jumped to No. 4 overall.
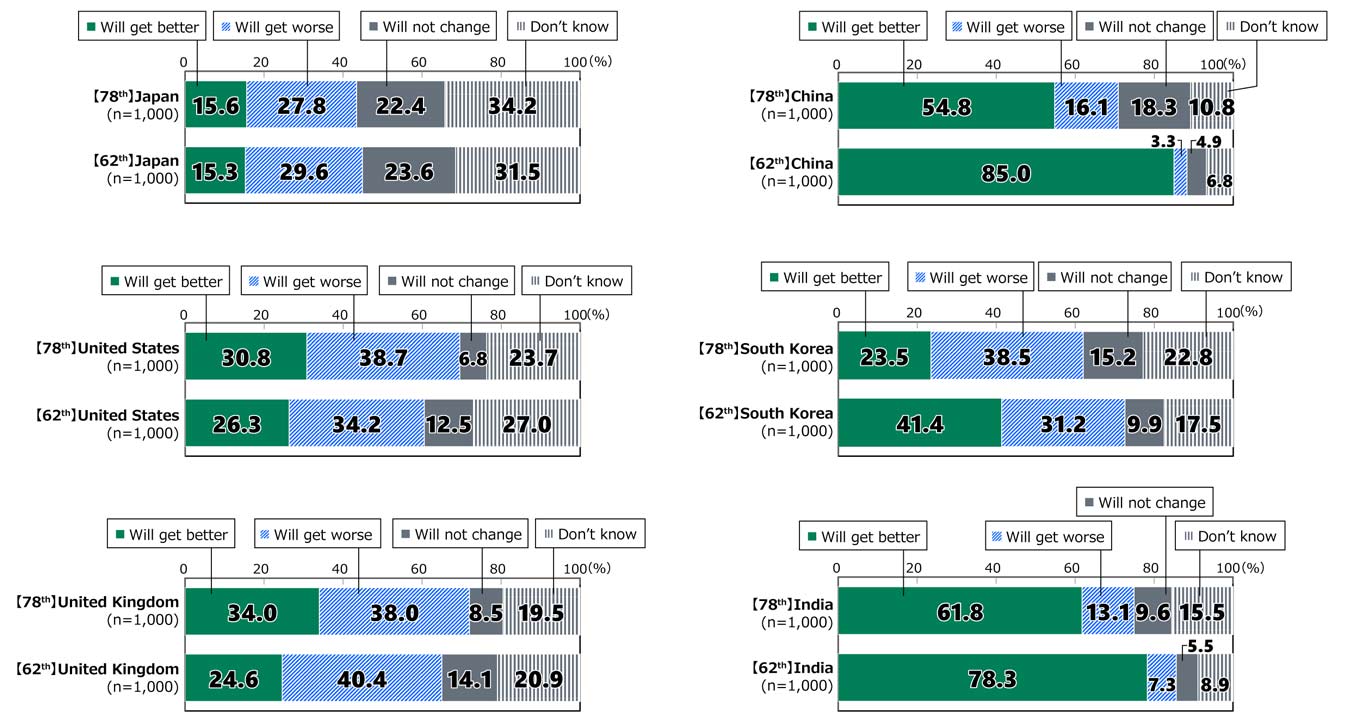
With regard to their own country’s future, although more than half of Indian and Chinese respondents replied that it “Will get better,” there were higher percentages of respondents in the remaining four countries who replied that it “Will get worse.” Furthermore, in addition to India and China, the percentage of respondents in South Korea who replied “Will get better” declined, and among Chinese respondents in particular, the decline was roughly 30 percentage points. At 16%, the figure for Japan increased slightly from the previous survey, but was still the lowest among the six countries. In the 20th survey, carried out in nine countries in 2019, the percentage of Japanese respondents replying “Will get better” was 9.6%, which was roughly one-fourth of those replying “Will get worse.”
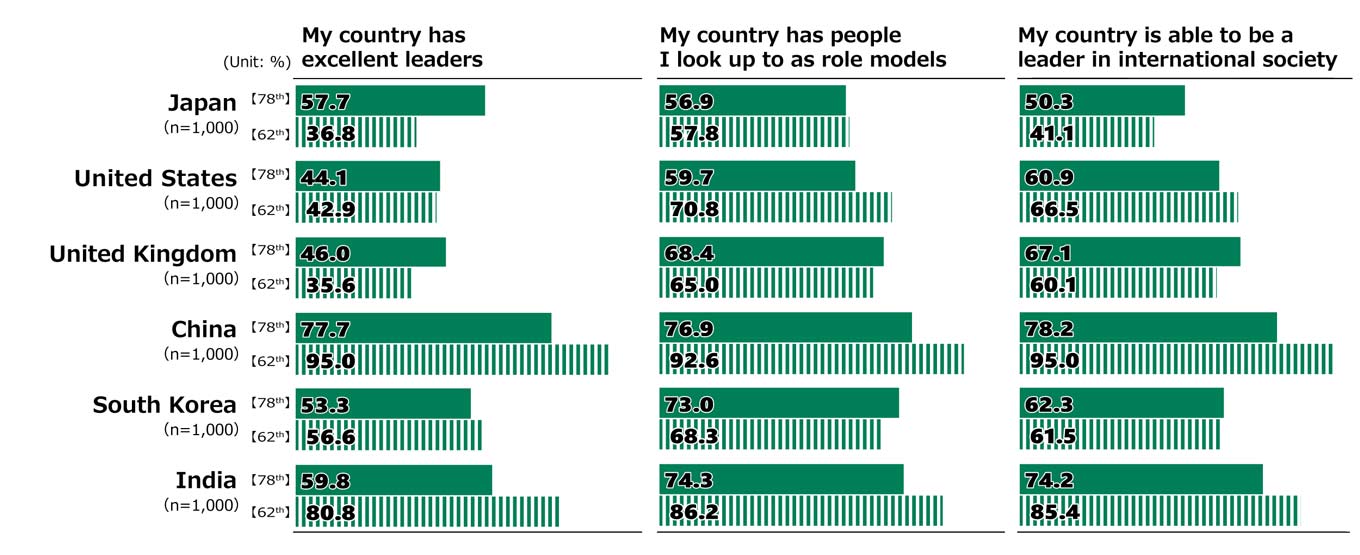
In terms of their own country’s present circumstances, close to 60% of Japanese respondents said “My country has excellent leaders,” a roughly 20 percentage point increase from the previous survey and higher than in the United States, the United Kingdom, and South Korea. The percentage of Japanese respondents replying that “My country is able to be a leader in international society” also rose, but was still 10 to 20 percentage points lower than for the other five countries.
For reference, please also refer to the previous related “Society and Country” surveys: No. 20 (Nine-country survey; November 2019); No. 46 (Six-country survey; March 2022; and No. 62 (Six-country survey; April 2024).
Overview of the 78th Awareness Survey of 18-Year-Olds – Country and Society (6-Country Survey)
My own country’s future
Percentage of respondents replying “Will get better”
78th Survey: India – 61.8%; China – 54.8%; United Kingdom – 34.0%; United States – 30.8%; South Korea – 23.5%; Japan – 15.6%
62nd Survey: China – 85.0%; India – 78.3%; South Korea – 41.4%; United States – 26.3%; United Kingdom – 24.6%; Japan – 15.3%
My country today
- Total percentage of respondents replying “Agree” or “Somewhat agree.”
My country has excellent leaders
| Japan | United States | United Kingdom | China | South Korea | India | |
|---|---|---|---|---|---|---|
| 78th Survey | 57.7 | 44.1 | 46.0 | 77.7 | 53.5 | 59.8 |
| 62nd Survey | 36.8 | 42.9 | 35.6 | 95.0 | 65.6 | 80.8 |
My country has people I look up to as role models.
| Japan | United States | United Kingdom | China | South Korea | India | |
|---|---|---|---|---|---|---|
| 78th Survey | 56.9 | 59.7 | 69.4 | 76.9 | 73.0 | 74.3 |
| 62nd Survey | 57.8 | 70.8 | 65.0 | 92.6 | 68.3 | 86.2 |
My country is able to be a leader in international society
| Japan | United States | United Kingdom | China | South Korea | India | |
|---|---|---|---|---|---|---|
| 78th Survey | 50.3 | 60.9 | 67.1 | 78.2 | 62.3 | 74.2 |
| 62nd Survey | 41.1 | 66.5 | 60.1 | 95.0 | 61.5 | 85.4 |
Major issues facing my country (up to three replies allowed)
| Japan | United States | United Kingdom | China | South Korea | India | |
|---|---|---|---|---|---|---|
| No. 1 | Declining birthrate | Racial, etc. discrimination and prejudice | Poverty | Aging population | Declining birthrate | Quality of education |
| No.2 | Aging population | Poverty | Racial, etc. discrimination and prejudice | Quality of education | Aging population | Poverty |
| No.3 | Economic growth | Terrorism and crime | Terrorism and crime | Economic growth | Economic growth | Environmental pollution |
| No.4 | Increase in immigrants | Quality of education | Economic growth | Environmental pollution | Quality of education | Economic growth |
| No.5 | Natural disasters | Climate change / Global warming | Climate change / Global warming | Declining birthrate | Climate change / Global warming | Terrorism and crime |
My own life
- Total percentage of respondents replying “Agree” or “Somewhat agree.”
| Japan | United States | United Kingdom | China | South Korea | India | |
|---|---|---|---|---|---|---|
| I enjoy my daily life | 63.7 | 70.3 | 78.6 | 69.5 | 70.3 | 76.5 |
| I have dreams for the future | 62.4 | 80.2 | 83.1 | 74.0 | 71.6 | 86.3 |
| I have unique qualities I can be proud of | 58.6 | 76.5 | 82.6 | 70.1 | 64.9 | 83.7 |
| I am needed by others | 57.2 | 70.6 | 72.6 | 72.9 | 69.3 | 71.9 |
| Even if I face difficulties, I can look ahead and overcome them | 56.8 | 77.0 | 76.3 | 71.8 | 75.4 | 81.4 |
My own relationship with society
- Total percentage of respondents replying “Agree” or “Somewhat agree.”
| Japan | United States | United Kingdom | China | South Korea | India | |
|---|---|---|---|---|---|---|
| I would like to be useful to my country and society | 68.0 | 76.7 | 79.7 | 78.3 | 75.4 | 83.7 |
| I am a responsible member of society | 65.4 | 74.3 | 80.5 | 75.8 | 74.2 | 84.4 |
| I have my own opinions on politics, elections, and social issues | 63.3 | 77.5 | 78.1 | 71.7 | 71.6 | 82.9 |
| I consider myself to be an adult | 53.9 | 71.1 | 76.6 | 66.3 | 54.9 | 79.4 |
| I believe my own actions can change my country and society | 52.7 | 66.7 | 66.3 | 69.5 | 60.8 | 78.0 |
What I value most in life
| Japan | United States | United Kingdom | China | South Korea | India | |
|---|---|---|---|---|---|---|
| No.1 | Things I enjoy or like to do, hobbies | Family | Family | Family | Family | Family |
| No.2 | Family | Friends | Friends | Physical and mental health | Things I enjoy or like to do, hobbies | Physical and mental health |
| No.3 | Friends | Physical and mental health | Physical and mental health | Things I enjoy or like to do, hobbies | Taking care of myself, relaxation | Work and learning new skills |
Survey Excerpts
My own country’s future
How do you view your own country’s future?
My own country’s present circumstances
How do you view your own country’s present circumstances (percentages shown are the total of respondents replying “Agree” and “Somewhat agree”)
Major issues facing my country (up to three replies allowed)
Japan (n=1,000)
- Declining birthrate (41.5%)
- Aging population (37.1%)
- Economic growth (27.9%)
- Increase in immigrants (19.2%)
- Natural disasters (16.3%)
United States (n=1,000)
- Racial, etc. discrimination and prejudice (36.8%)
- Poverty (30.9%)
- Terrorism and crime (24.0%)
- Quality of education (22.4%)
- Climate change / Global warming (21.3%)
United Kingdom (n=1,000)
- Poverty (36.6%)
- Racial, etc. discrimination and prejudice (32.5%)
- Terrorism and crime (27.1%)
- Economic growth (24.4%)
- Climate change / Global warming (24.0%)
China (n=1,000)
- Aging population (29.1%)
- Quality of education (26.0%)
- Economic growth (20.0%)
- Environmental pollution (18.9%)
- Declining birthrate (18.0%)
South Korea (n=1,000)
- Declining birthrate (64.0%)
- Aging population (51.6%)
- Economic growth (25.1%)
- Quality of education (23.9%)
- Climate change / Global warming (17.8%)
India (n=1,000)
- Quality of education (40.9%)
- Poverty (33.7%)
- Environmental pollution (31.1%)
- Economic growth (21.1%)
- Terrorism and crime (20.8%)
What I value most in life (up to three replies allowed)
Japan (n=1,000)
- Things I enjoy or like to do, hobbies (48.0%)
- Family (41.6%)
- Friends (35.0%)
- Physical and mental health (33.5%)
- (Romantic) love (19.2%)
United States (n=1,000)
- Family (50.2%)
- Friends (36.0%)
- Physical and mental health (34.9%)
- Things I enjoy or like to do, hobbies (30.5%)
- Taking care of myself, relaxation (29.3%)
United Kingdom (n=1,000)
- Family (52.0%)
- Friends (39.5%)
- Physical and mental health (36.5%)
- Taking care of myself, relaxation (29.4%)
- Things I enjoy or like to do, hobbies (28.3%)
China (n=1,000)
- Family (39.2%)
- Physical and mental health (34.0%)
- Things I enjoy or like to do, hobbies (33.4%)
- Building wealth (30.8%)
- Taking care of myself, relaxation (25.9%)
South Korea (n=1,000)
- Family (54.1%)
- Things I enjoy or like to do, hobbies (44.9%)
- Taking care of myself, relaxation (34.8%)
- Friends (33.9%)
- Building wealth (30.0%)
India (n=1,000)
- Family (56.2%)
- Physical and mental health (41.0%)
- Work and learning new skills (30.2%)
- Friends (29.7%)
- Taking care of myself, relaxation (29.2%)
Previous Multi-Country Awareness Surveys of 18-Year-Olds
- 62nd Awareness Survey of 18-Year-Olds (2024)
- 46th Awareness Survey of 18-Year-Olds (2022)
- 20th Awareness Survey of 18-Year-Olds (2019)
About the Awareness Survey of 18-Year-Olds
Revisions to Japan’s Civil Code lowering the age of adulthood to 18 for a range of activities, including voting, took effect in April 2022, making it even more important to understand and record the awareness of the 18-year-olds who represent Japan’s next generation. With this in mind, in October 2018 The Nippon Foundation launched the Awareness Survey of 18-Year-Olds as an ongoing survey of young men and women across Japan aged around 18, to survey their values, attitudes toward politics and elections, understanding of social issues, and other current themes on an ongoing basis.
About the 78th Installment – Country and Society (6-Country Survey)
| Survey coverage | 1,000 respondents each, from Japan, the United States, the United Kingdom, China, South Korea, and India, comprising male and female respondents aged 17-19 |
|---|---|
| Survey period | February 2-24, 2026 |
| Survey method | Internet survey |
Related Link
Contact
Public Relations Division
The Nippon Foundation
- Email: pr@ps.nippon-foundation.or.jp